Outcome measurement
Measuring reCAPTCHA recognition success rates
Measuring reCAPTCHA recognition success rates. Measure recognition requests, workflow outcomes, and integration errors with clear criteria.
By the easycaptcha team · Published
Separate a completed API task, correctly applied selections, accepted challenge, and completed application action. Label the metric with its stage. A transport success rate measures a different boundary from whether a user finished a form.
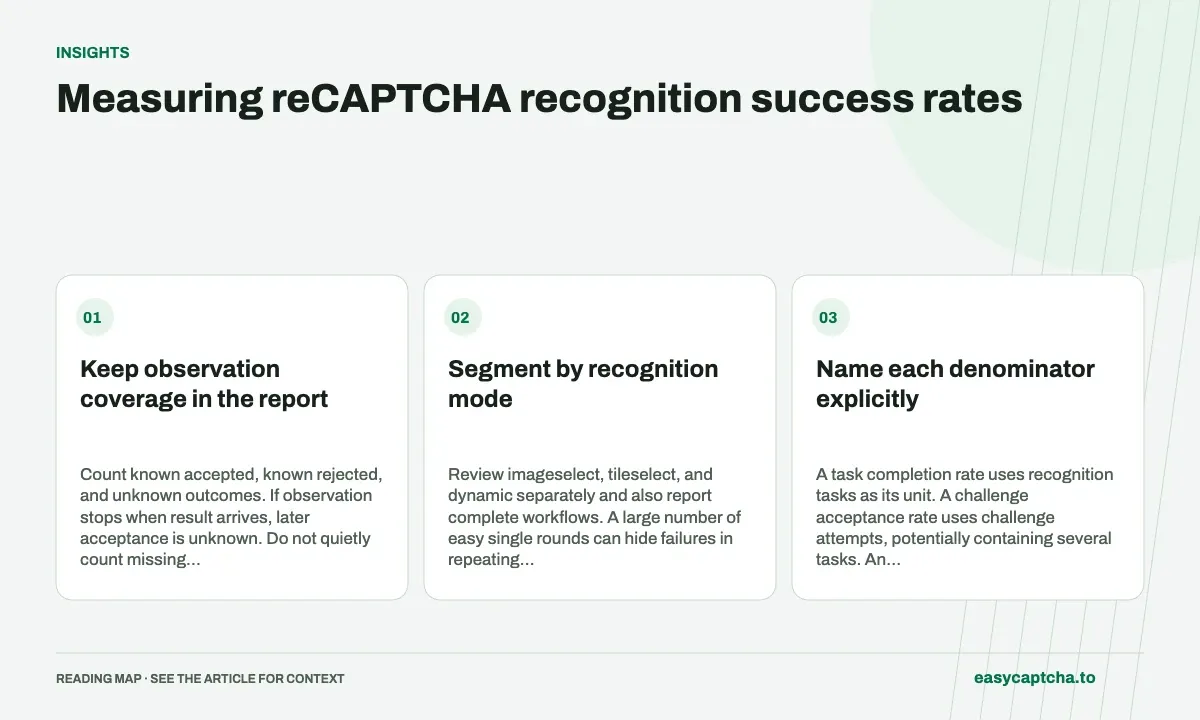
Keep observation coverage in the report
Count known accepted, known rejected, and unknown outcomes. If observation stops when result arrives, later acceptance is unknown. Do not quietly count missing observations as successful or remove them from the cohort without explanation.
Segment by recognition mode
Review imageselect, tileselect, and dynamic separately and also report complete workflows. A large number of easy single rounds can hide failures in repeating challenges. Keep the same observation window when comparing releases.
Name each denominator explicitly
A task completion rate uses recognition tasks as its unit. A challenge acceptance rate uses challenge attempts, potentially containing several tasks. An application completion rate uses the action the person intended to perform, such as submitting a form. These units are related but cannot be substituted for one another in a headline.
Define a started attempt at a reproducible boundary and state how resets and retries are counted. For example, a new instruction after a reset can be a new challenge within the same application workflow. Keep that relationship in your records so multiple paid tasks do not artificially inflate the number of independent user attempts.
Calculate observed acceptance and coverage together
Suppose an illustrative cohort starts 100 challenge attempts. You observe 72 accepted challenges and eight rejected challenges, while 20 outcomes remain unknown. Acceptance among known outcomes is 72 / 80 = 90%. Observation coverage is 80 / 100 = 80%. Neither figure should be omitted when presenting the cohort.
The data does not establish 90% acceptance across all 100 attempts. Unknown cases may include unusually slow or difficult workflows, so assuming they resemble the observed group can bias the conclusion. Record why observations ended where possible: browser closure, a local deadline, navigation, or missing instrumentation can have different operational implications.
Keep a stage-level outcome table
| Stage | Positive evidence | What it does not establish |
|---|---|---|
| Recognition task | Completed array returned | Correct browser application |
| Selection application | Current mapped cells handled | Challenge acceptance |
| Challenge acceptance | Observed accepted challenge | Successful final form action |
| Application completion | Intended confirmation observed | A universal provider success rate |
A form can fail after challenge acceptance because another field is invalid. A recognition result can become stale before any selections are applied. Label these outcomes at their own stages instead of forcing both into a classifier success-or-failure field. This makes the report useful to the team responsible for each component.
Compare releases with matched observation rules
Use comparable grid-mode and replacement-depth cohorts when reviewing a change. Keep the cutoff window, polling policy, and meaning of acceptance consistent. A release that stops observing slow attempts earlier can appear to improve its observed success rate while simply moving more difficult cases into an unreported unknown category.
Also inspect absolute counts and error reasons before acting on a percentage. A small cohort with one extra reset can move sharply without establishing a broad regression. Pair acceptance and coverage with whole-workflow latency and cost per completion so an apparent gain can be assessed alongside its operational cost.
Prevent instrumentation changes from looking like quality gains
Suppose a release begins recording challenge acceptance after it previously stopped at recognition completion. The resulting percentages describe different stages, even if the dashboard label stays the same. Version metric definitions and record when observation behavior changes so the team does not interpret a measurement correction as a change in recognition quality.
The reverse can also happen: removing a browser listener can leave difficult cases unknown while completed tasks continue to be counted as successes. Compare event counts at each boundary and check that accepted-challenge events are supported by actual observation. A rising task completion rate cannot fill a missing final-outcome stream.
Use controlled sequences to verify the reporting path itself: completed recognition followed by a reset, accepted challenge followed by a form error, and a session that ends before final observation. Each should produce the intended stage labels and unknown categories. This makes the success report an auditable description of evidence rather than a percentage generated by whichever callback happened to fire first.
Frequently asked questions
Does completed status prove challenge acceptance?
No. It proves the recognition task returned a result; acceptance requires observing the challenge outcome.
How do I handle unknown outcomes?
Report them separately and disclose observation coverage. Do not assume missing outcomes are successful or silently omit them from the cohort.
Can challenge acceptance and application completion differ?
Yes. A form can fail validation after challenge acceptance, so record those outcomes at separate stages.